1. Direct Execution
Example run
To run the tool in batch mode from the command line:
Example run with H5ad file:
python3 -m eML.classify \
  --batch patient_ID \
  --adata_file /mnt/adata_query.h5ad \
  --proteins_file /app/src/data/proteins_to_check.txt \
  --patient pan_cancer \
  --adversarial_classifier False \
  --output_dir /mnt/output \
  --ref_model /app/src/data/models/totalvi_vae_reference_model_withclassifiers \
  --ref_adata /app/src/data/models/totalvi_vae_reference_model_withclassifiers.h5ad
Another example run with CSV files:
python3 -m eML.classify \
  --batch Data.source_Chemistry \
  --RNApath /mnt/rna_counts.csv \
  --metapath /mnt/meta.csv \
  --ref_model /app/src/data/models/totalvi_vae_reference_model_withclassifiers \
  --ref_adata /app/src/data/models/totalvi_vae_reference_model_withclassifiers.h5ad \
  --classifier_type BBC \
  --proteins_file /app/src/data/proteins_to_check.txt \
  --output_dir /mnt/output \
  --patient batch_Datasource
Output File Structure:
output_dir/
├── <patient>_arguments_used.txt
├── <patient>_prepped.h5ad
├── <patient>_probabilities<classifier_type>output.csv
├── <patient>_eMLclassified_adata.h5ad
└── <patient>_vae_model_withclassifiers/
     └── model.pt
Visualize output data
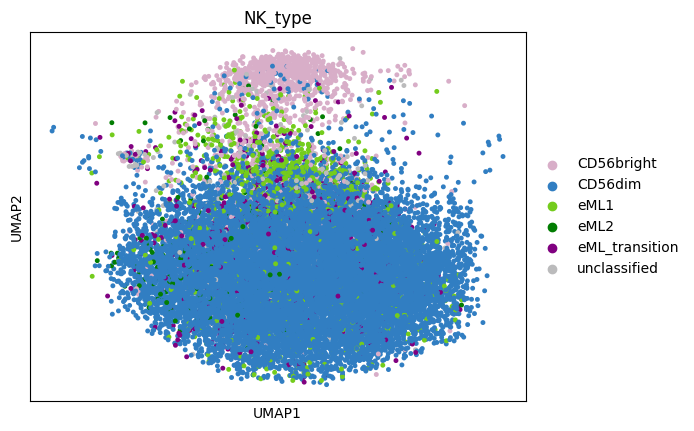
Umap of NK_type in eML_classified_adata:
sc.pl.umap(adata_PBMC_eMLclassified, color='NK_type', size=45 )
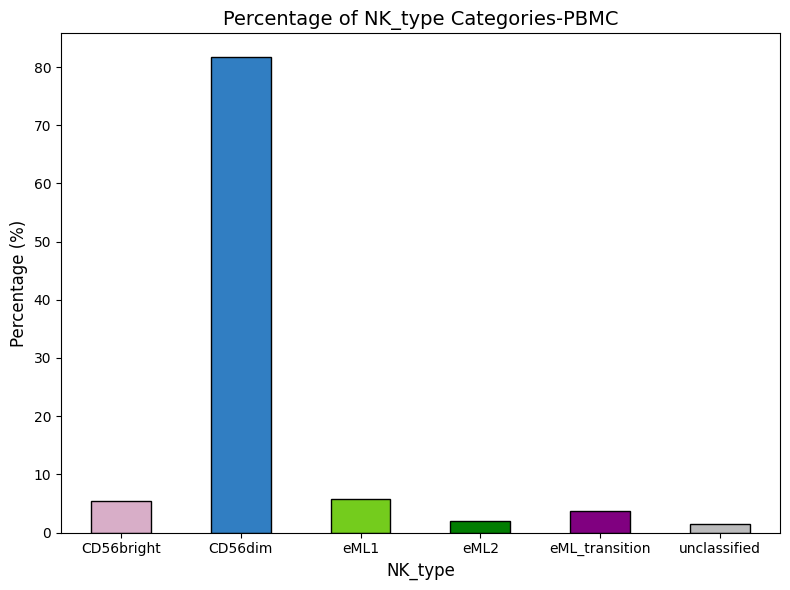
Barplot of NK_type in eML_classified_adata:
# Define the desired order for NK_type categories
desired_order = ['CD56bright', 'CD56dim', 'eML1', 'eML2', 'eML_transition', 'unclassified']

# Define colors for each category using the provided hex codes
colors = ['#D8AEC8' ,  '#317EC2' , '#74CC1D', '#027D02', 'purple', '#BBBBBC']

# Calculate the percentage of each NK_type category
NK_type_counts = adata_PBMC_eMLclassified.obs['NK_type'].value_counts(normalize=True) * 100

# Reorder NK_type_counts based on the desired order
NK_type_counts = NK_type_counts[desired_order]

# Plot the percentages with the desired order and assigned colors
plt.figure(figsize=(8, 6))
NK_type_counts.plot(kind='bar', color=colors, edgecolor='black')

# Customize labels and title
plt.title('Percentage of NK_type Categories-PBMC', fontsize=14)
plt.xlabel('NK_type', fontsize=12)
plt.ylabel( 'Percentage (%)', fontsize=12)
plt.xticks(rotation=0 )

# Optimize layout and show the plot
plt.tight_layout()
plt.show()
Visualize ouput data more with Scanpy Documentation.
Note:
Slight differences in decimal values (floating-point results) depending on whether computations are performed on a GPU or CPU may be observed.